Chameleon CG – Flexible Preview Channel Among Other Things

Chameleon CG has a designer application where all graphics are created. It looks similar to a traditional CG:

But it departs traditions on the playout side. Any scene created in the Chameleon CG is published to the Chameleon database ready to be utilized as a template for branding assets or the sequencer. Triggering isn’t done by the Designer application but instead from the standard Chameleon web interface called Flow. Once a template is published, everything happens in Flow from creating assets to triggering them to the program and preview channels..

This means there isn’t anything needed to install locally to use the Chameleon CG. And there is no limit of what platform Chameleon CG supports because any platform that has a web browser supports the Chameleon CG including mobile phones, tablets, Raspberry pi, Mac, Linux, Windows,…

To aid in flexibility, any Chameleon instance can support unlimited channels. If a template is published, it has the potential to be used by multiple channels and all triggered from Flow. In fact, a single instance of Chameleon can be shared by multiple unrelated broadcasters through Chameleon’s silo mechanism, content groups; a further way to monetize a single instance of Chameleon for unrelated events, channels or broadcasters.

Rendering can happen to a browser, NDI or SDI depending on the player being utilized. Preview channels can also be defined and rendered to a browser, NDI or SDI. Furthermore, one can have a program channel render to SDI and the preview channel to a browser or the other way around. Whatever makes sense. In this example, we’re rendering both program and preview channels to a browser. The left browser window is the program channel and the right browser window is the preview channel.

This all works well for a remote production since Chameleon has been tuned for cloud support and the production team can trigger all graphics from their web browser.

Our NAB 2009 Discovery

The 2009 NAB Show was held between April 18th and 23rd with registration down 20% to just over 80,000 attendees. The exhibitors included established names such as Adobe, Canon, JVC, Microsoft, SAT-GE, Tektronix, 3M, Altera, Cisco, Verizon and Xilinx and promising names like Qualstar, Bogen Imaging, Dayport, LEN, Trilithic and YellowBrix. Cheers and Frasier actor Kelsey Grammer received the inaugural Television Chairman’s Award.

Bannister Lake had made a decision to find another platform for developing broadcast graphics applications and used NAB 2009 as our place for discovery. Up until then, we had settled on Inscriber and the RTX api but we had concerns about using only one platform. Our focus was to find the next dev platform for our broadcast applications. There were several candidates and we did our homework prior to the show. Francis, D’Arcy and I met with all the potential partners. Some looked promising, others not so much. On the Wednesday of the show, Francis and D’Arcy stumbled on a product that wasn’t on our radar prior to the show. It was a recent acquisition by Ross Video. The company was Media Refinery and the product was XPression.

With the show nearing its close on Thursday, Francis and D’Arcy dragged me into the Ross booth and an acquaintance from our Inscriber days, Hans Bijlsma, gave us a demo of XPression. The first thing that impressed me was how quickly it installed. No reboot! I didn’t get a full appreciation of the api yet but XPression looked like it could do everything we needed graphically. I remember closing the 2009 NAB show sipping champagne in the Ross booth. Francis and I had found our new platform.

Over the coming years, we developed ticker, branding, scorebug, elections and other custom solutions using XPression. We even developed a ticker and branding solution which Ross Video started OEMing in 2013 and is still having success today. A lot has changed over the years in how we use XPression but it continues to be a successful development platform for Bannister Lake.

Chameleon: An Open Platform for Developers and Users

Chameleon at its core is a database with a flexible database schema which can be used to contain almost any type of data. Through our hybrid design using the best of relational and key/value pair design, it becomes an ideal warehouse for data. And with a powerful web interface, users can organize data in unlimited ways.

What is less known about Chameleon are some of the more technical aspects, namely its capability as an open platform for developers and users. Here are some of the highlights: 

    • Chameleon API for writing graphics apps using Chameleon or external data
    • Open database design allowing 3rd parties to add parsers and other data related services
    • SDK for tight integration to Chameleon’s ticker and branding resources
    • BLADE – RESTful api providing endpoints to all containers in multiple formats
    • Community support – sharing data between instances of Chameleon
    • Dynamic Tags – foundation for extending existing data types
    • Custom data type when there isn’t a fit with one of the other standard data types
    • Query data type for creating dynamic playlists using any and all Chameleon data
    • Scripting support for html5 Designer
    • OEM Support and Interface Skinning/Feature Hiding

Chameleon.api

All the rendering for our html5 graphics is done on the client side (JavaScript on a client’s browser). But there’s a pipe of data between an application we call the Chameleon Web Server to tell JavaScript what project, scene and data mappings to use for each render.

The Chameleon.api is an interface to the Chameleon Web Server to allow it to do more than just tickers. This interface listens for commands to show a scene with a set of key/value pairs to map to fields in the scene. The api is a simple interface to load projects, set scenes online or offline, update an existing scene and a callback to signal the end of a render.

The Chameleon.api is available in nuget to integrate into 3rd party applications. Those applications might be scorebugs, sequencers or any custom requirement for rendering graphics. In fact, Bannister Lake uses this api for some of their own applications like the Branding and Elections Player.

We encourage developers to use the Chameleon.api to create the next great graphics application.

Open Database

Chameleon uses MySQL as its database system. It is an open-source relational database management system. It is a free and open-source software under the terms of the GNU General Public License and is also available under a variety of proprietary licenses. There are derivatives to MySQL such as MariaDB and others.

We learned early on that Bannister Lake could never provide all the data resources to populate our database. Language limitations limit our capability of writing resources for datafeeds of character sets like Kanji. We certainly can contain that data in Chameleon but without language experts, we have no way of interpreting the data.

For this reason, our goal was to open up the Chameleon database to internal and 3rd party developers to create parsers or any other data script for our Chameleon customers. For that purpose, we have made access to the Chameleon database open by providing common MySQL credentials to allow access to MySQL Workbench and MySQL connection tools for any type of software development. We even provide sample source code to parsers.

SDK

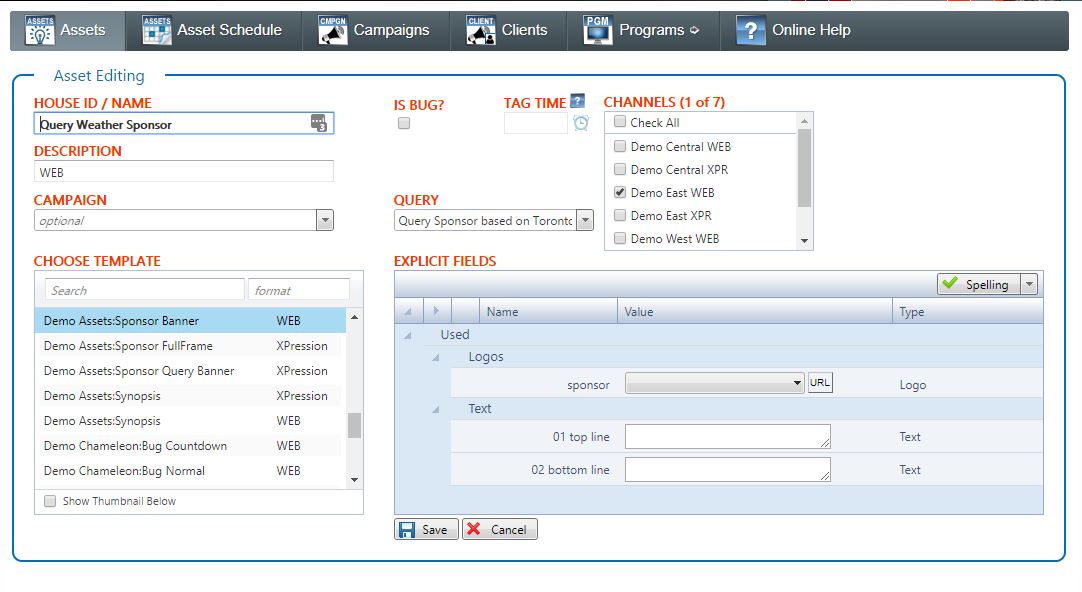
All of Chameleon’s data/containers can be used in a loose fashion through BLADE. It’s a powerful way to support all platforms including web widgets, character generators and digital signage. However, Chameleon allows for tighter integration of graphics through its SDK. This allows for tickers to use rundowns and branding assets.

Tight integration also requires publishing information about graphics to the database. This provides templates for generating bugs or snipes. It also provides the magic to include data containers for a rundown’s zones.

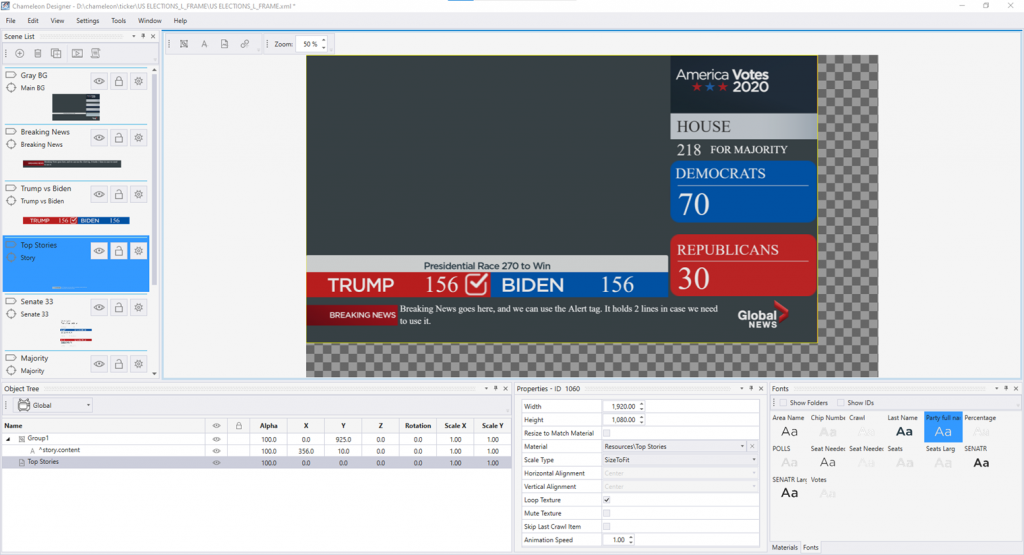
The SDK itself is on the playout side for creating players that can use all these database resources for tickers and branding. For tickers, it allows mapping containers to graphic zones in a ticker making it as simple as dragging a data container into a rundown. The SDK covers all the work behind the scenes to make this all work.

For example, here is a rundown for a zone in a show (our term for a group of zones)Zone Selection Rundown

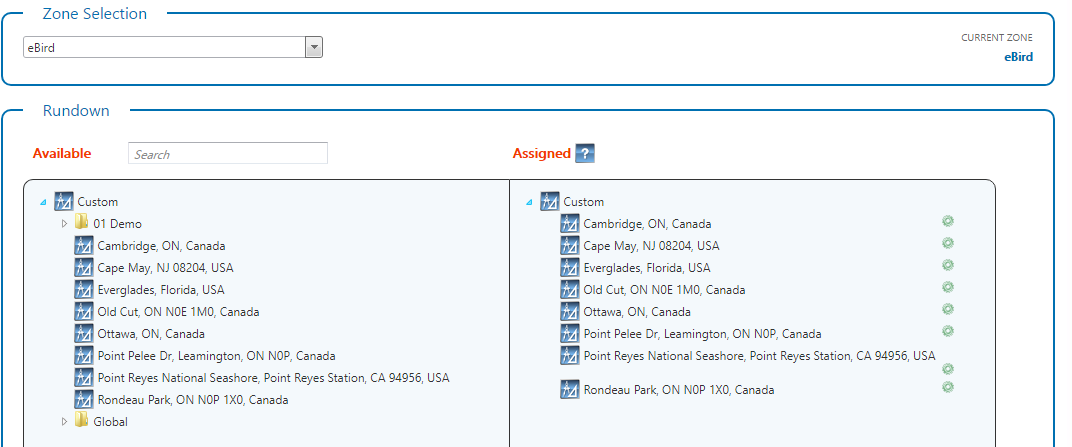
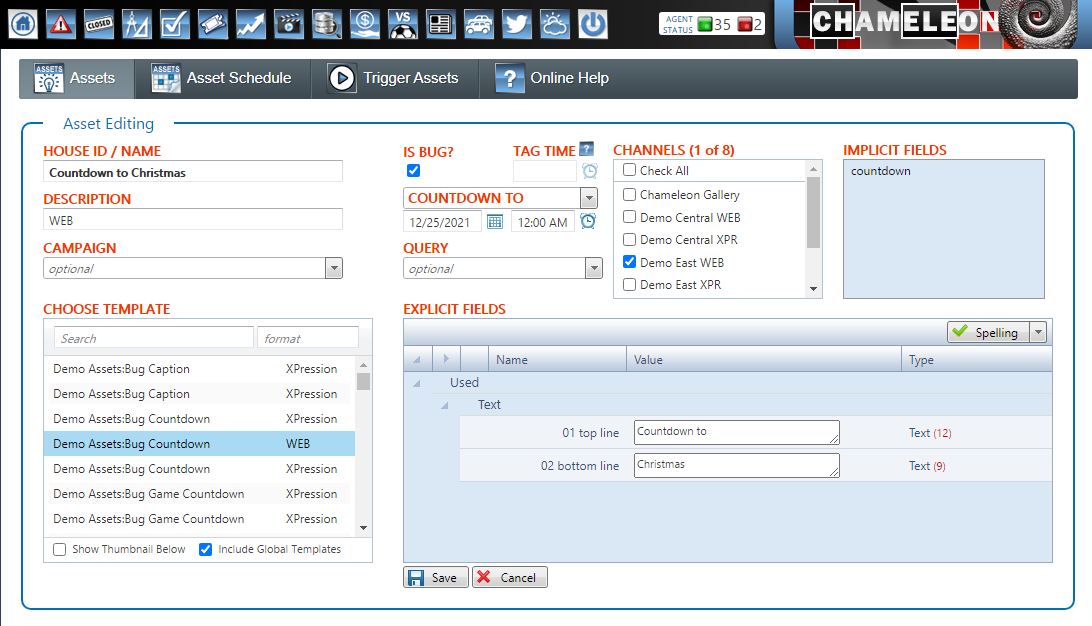
Using the information in the database when graphics are published, rundowns know what types of containers it can support. This tight integration of graphics also extends to branding assets. Here’s an asset defined to provide a countdown clock bug to Christmas:

Asset Editing - Countdown

When a platform supports these graphics-based resources in the Chameleon database, we call the platform tightly coupled. Once tightly coupled, a platform has some magic behind it where tickers and branding are all defined in Flow, Chameleon’s web interface.

The interface to the SDK for providing tightly coupled support is a series of methods that are not unlike the Chameleon.api where it supports information about bringing scenes online or offline and updating. It’s even possible to have an SDK implementation support Chameleon.api to provide additional 3rd party development support.

BLADE

Chameleon has an endless supply of data containers. Those containers might be a broadcast channel’s program schedule, world news, league scores, stock index quotes or weather for a group of cities. Each container has an endpoint for acquiring the data from a url to be used with any platform whether it’s a ticker (broadcast, digital signage, streaming,…), website, branding or character generator.

BLADE (Bannister Lake Active Data Exchange) is a RESTful api to all that data. There is a url to pull any Chameleon container. Not only that, Flow provides a page to discover the urls. For example, if we wanted to find the json url for getting the Dow Jones 30 components, Flow’s BLADE discovery page makes it easy. No docs to read. Just pick what you want:Bannister Lake BLADE UI

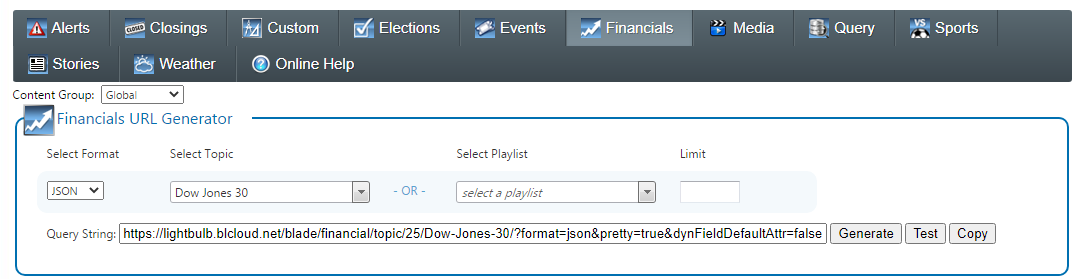
The url discovered here is an active and live resource located on one of our cloud instances and formatted in json. Go ahead and give it a try:

https://lightbulb.blcloud.net/blade/financial/topic/25/Dow-Jones-30/?format=json&pretty=true&dynFieldDefaultAttr=false

Originally, BL created a central location to store useful information like sports scores or weather forecasts. This was intended as a data resource for our customers. We also opened it up so that data providers could login to an instance of Chameleon and edit their own data for broadcasting purposes.

But we went further with this idea. What we came up with is a way to share data between any Chameleon instance. Basically, Community Support provides a way of syncing a container with a container from another Chameleon instance (another database) or even between content groups of the same Chameleon instance. We call these container to container syncs maps.

In Flow, users can setup maps by defining the Chameleon instance source and then mapping a source container to a destination container:

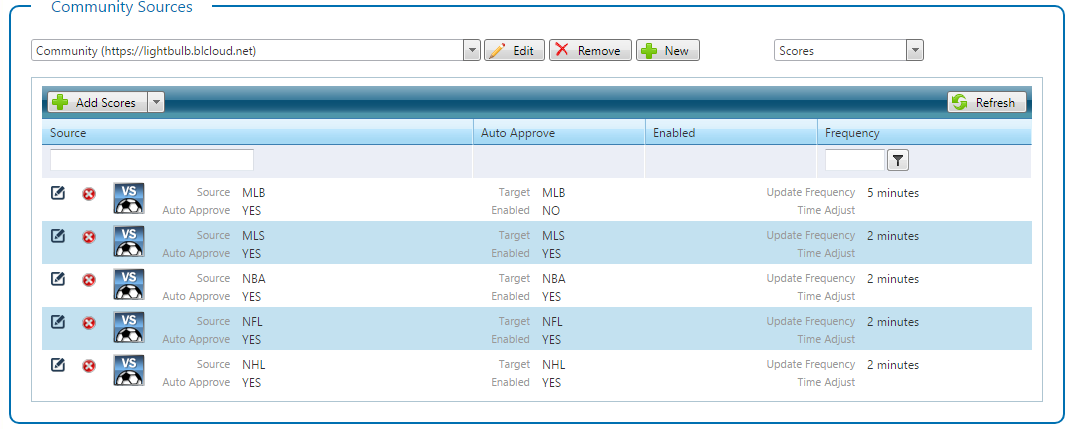
In this example, we’re mapping the Chameleon instance located at https://lightbulb.blcloud.net all the sport scores for leagues MLB, MLS, NBA, NFL and NHL. We support mapping of most Chameleon containers, even query source containers (mapped to Custom).

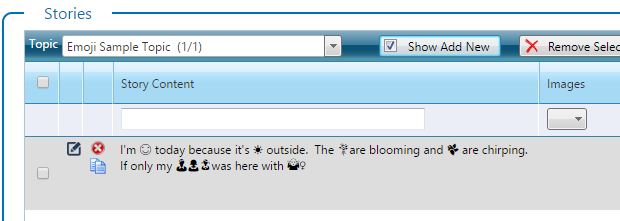
Dynamic Tags (aka Dynamic Fields)

Early on in the design of Chameleon, we found the need to extend existing data types with additional fields. For example, each sport has unique data beyond team names, scores and status. While baseball might need information on who is up to bat, the count, team errors and so much more, a sport like hockey might need shots on goal, hits, penalty/power play information. There are 2 ways to approach this problem. Either add new fields to a relational data table (forever) or attach additional data to a core data type. We chose the 2nd method. All of the Chameleon data types have support for extending data by attaching dynamic tags to records. These dynamic tags can be text, numbers, dates, boolean, json or media. We even went all in on this idea by having a data type we call Custom which is essentially just dynamic tags.

For example, here’s a simple dynamic tag providing a logo for episodes of Bonanza:

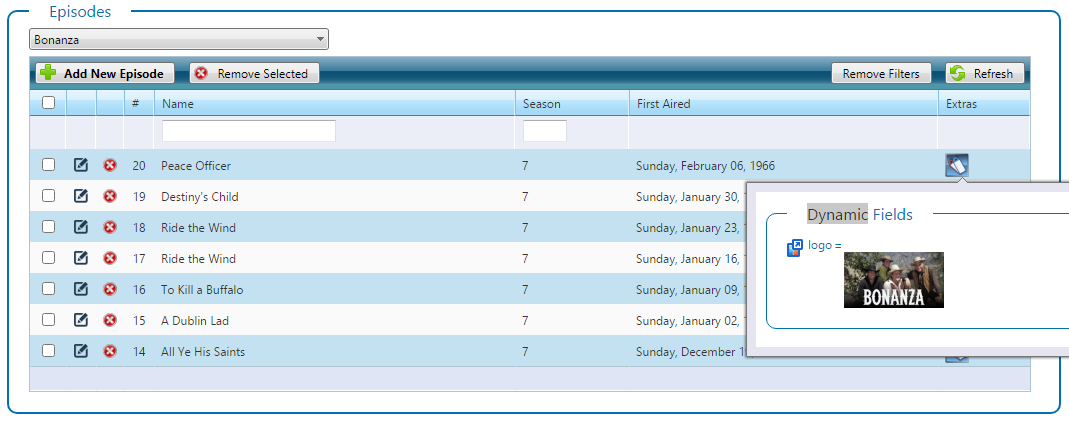
And here are dynamic tags for an NHL player:

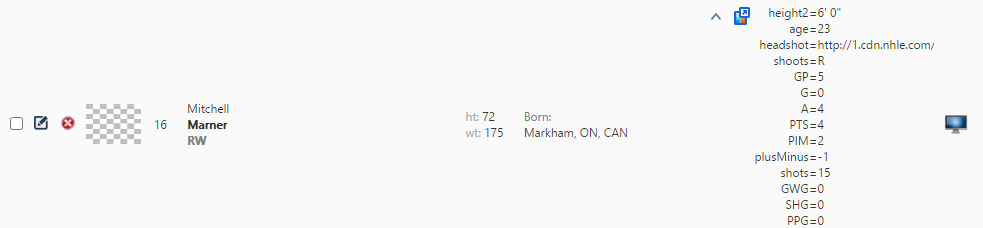
Note that we are working on a new data type for dynamic tags: set. Basically, a set is a set of dynamic tags. This is a way for any dynamic tag to reference a set of dynamic tags providing full hierarchy of data. This could be used to store season or game information for players or teams. It could also be used to store different language versions for a story.
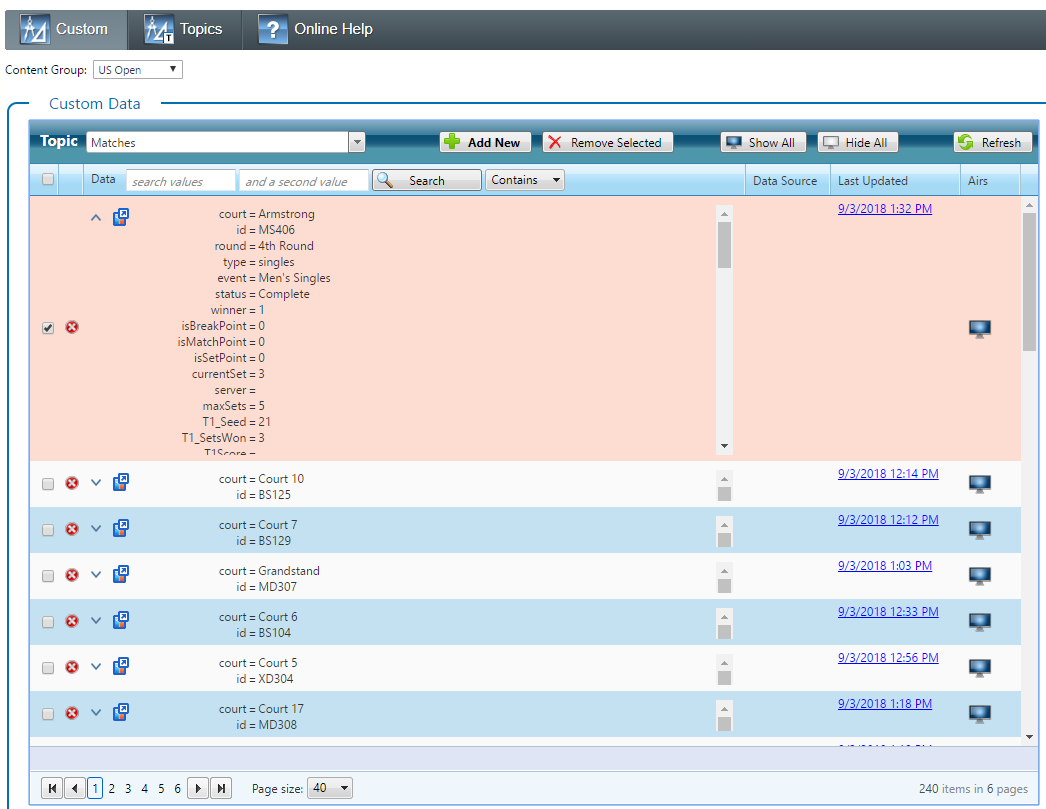
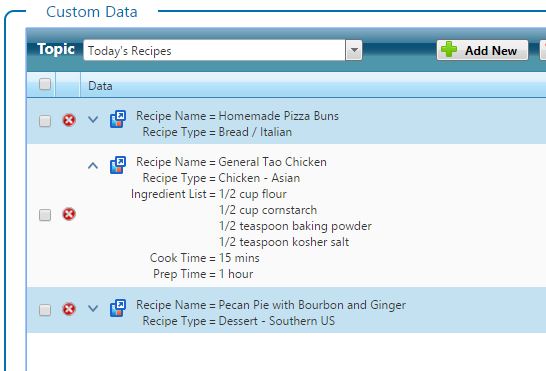
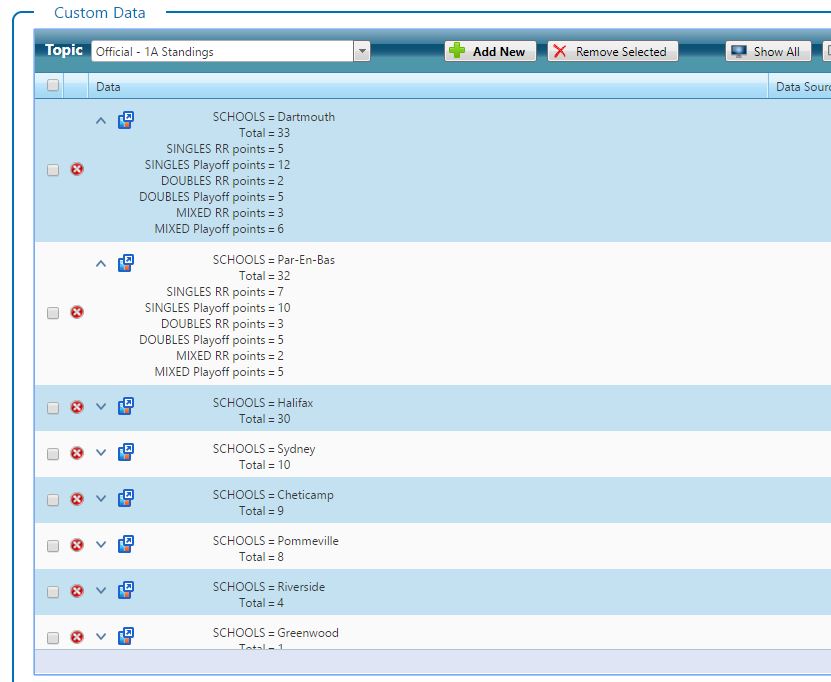
Custom Data Type

Not all data fits into standard Chameleon data types such as story, weather or finance. That’s where the Custom data type comes in. It is essentially key/value pairs attached to records. Chameleon calls these key/value pairs dynamic tags or dynamic fields. Although all the other data types have key/value pair support, the Custom data type is exclusively key/value pairs. Any 2 dimensional data is a good candidate for using the Custom data type. For example, a spreadsheet is a good example of what is a good fit for Custom where each column is a field and each row are the values to a record.

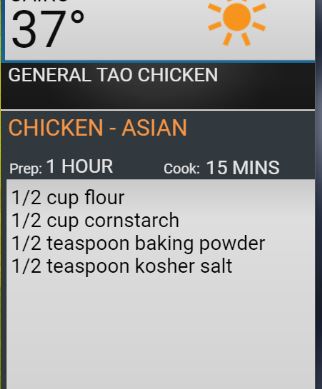
A good example of the use of Custom is containing COVID-19 data. For example, here is Canadian COVID-19 data organized by province: Here we’re showing some of the fields for the province of Quebec.

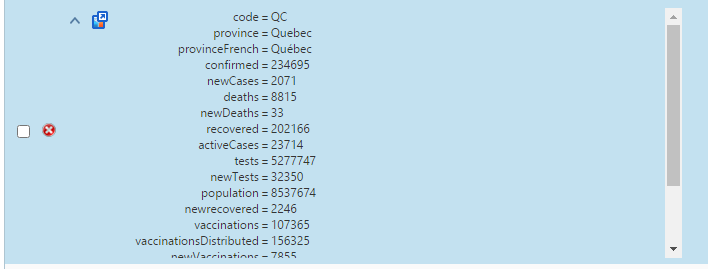
Another example is organizing medal counts for events like the Winter Olympics:

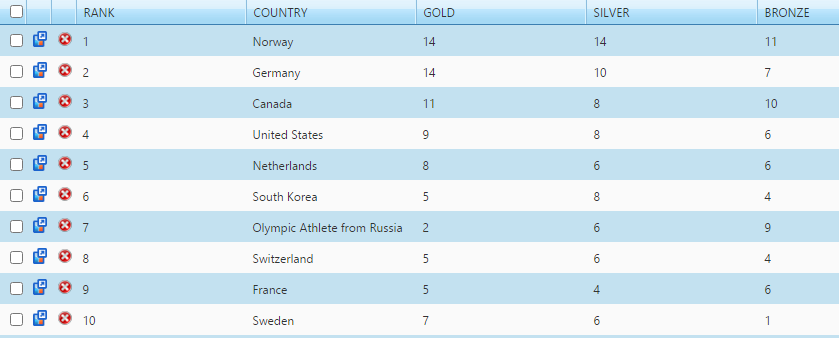
Like all dynamic tags in Chameleon, key/value pairs can be strings, dates, numbers, booleans or media. Custom data is organized in topics and is just another container to Chameleon where it can be used like any other container.
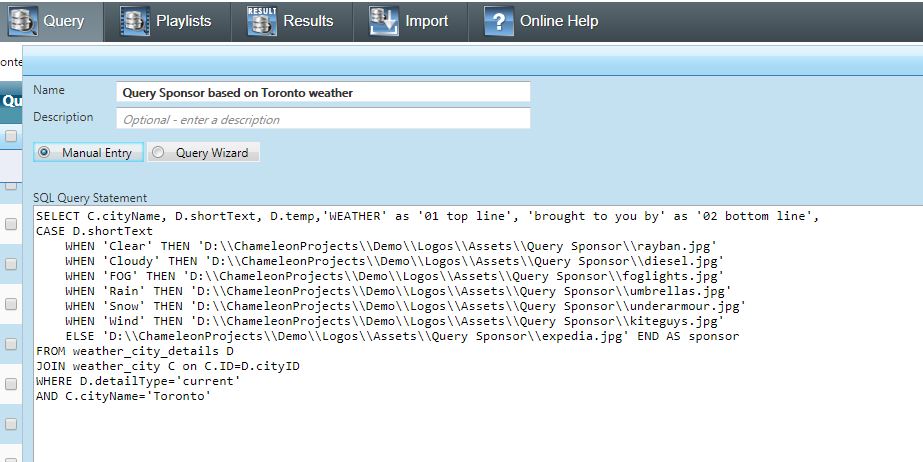
Query Data Type

Query is Chameleon’s method for creating dynamic playlists and to format data in a precise way. For example, if we had all the Dow Jones components in a Financial container ordered ascending by symbol: 

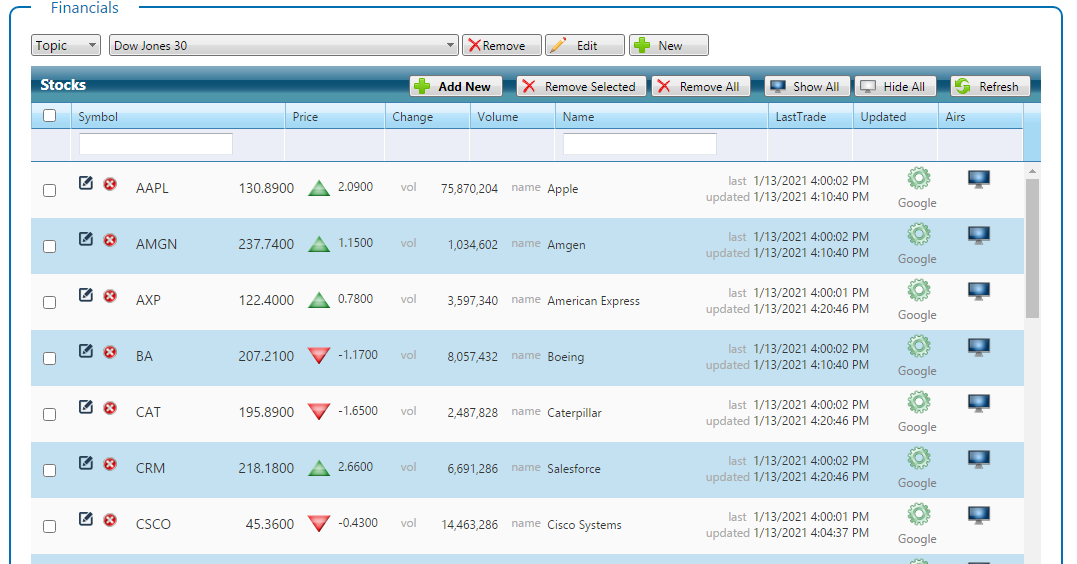
What if we wanted the data sorted descending by volume? One could create a playlist and manually order by volume but when the markets are open, the data is highly dynamic. That’s where Query comes in. It can create dynamic playlists. And these playlists are treated like any other container in Chameleon with the difference being the query behind it gets executed whenever utilizing the container. 

Query is based on writing SQL SELECT statements. These statements are what get executed on the container. Any data in the database is fair game for query. Here’s an example of the SELECT statement behind a query for getting the top 10 volume leaders for the Dow Jones 30 components:

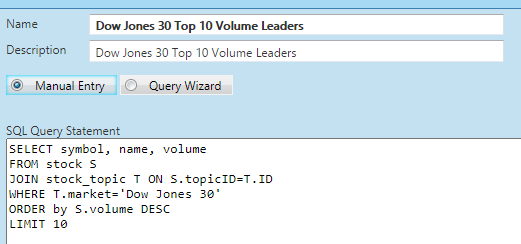
The above query gives us:
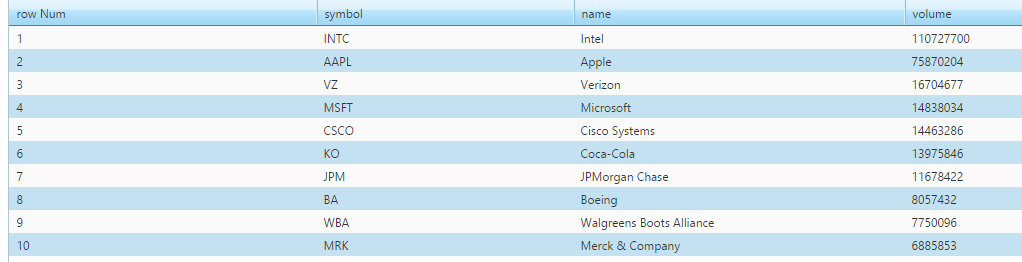
Designer Scripting

Most character generators or graphics environments have some form of scripting support. Chameleon’s web renderer is no different in that respect. It allows writing scripts to accomplish dynamic tasks. For example, here’s a script for a scene that shows sports scores. It will mark the team with the colour red if the team is leading or has won: 

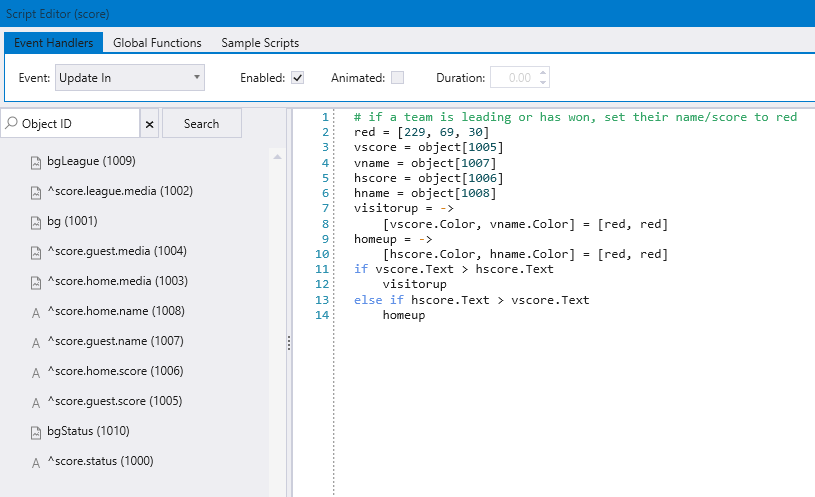
Designer uses CoffeeScript as its scripting language which gets translated to JavaScript at render.

OEM Support and Interface Skinning/Feature Hiding

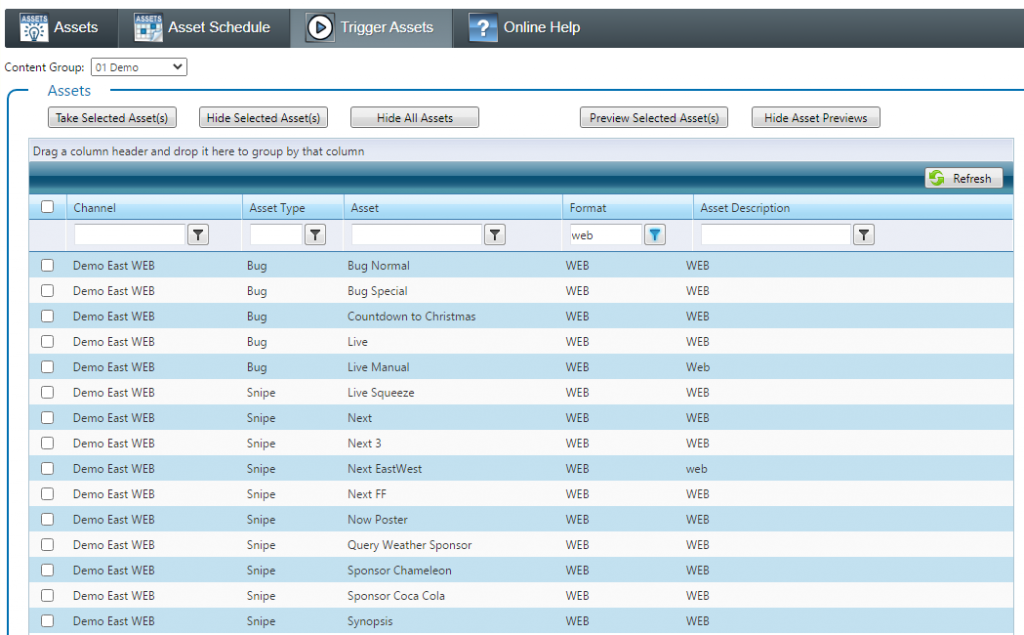
Chameleon’s most visible interface is Flow. Flow is the web interface which provides access to the world of Chameleon; not just the data but the operational aspects of data like triggering graphics. From the beginning, Flow provided support for skinning Flow. For example, each election, we’d provide a different skin for our election users. We also provide support for hiding features so users aren’t bombarded with things they don’t need or want.

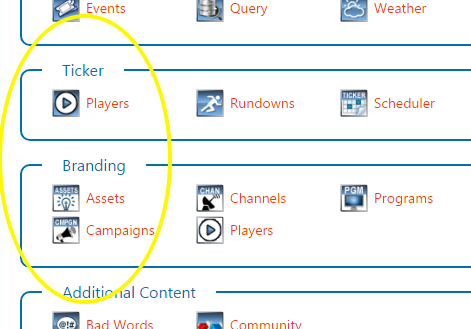
Flow can easily hide content by turning on and off features. If an instance of Chameleon is used for only sharing/working with certain data types, it’s easy to hide features. For example, here is what is available for our Community instance:

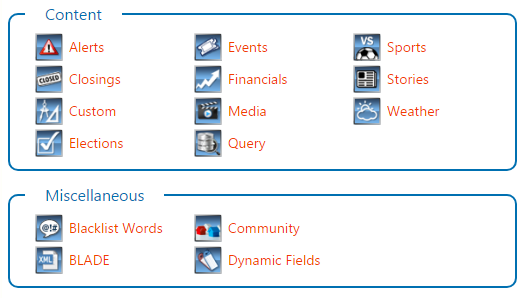
While an instance like our Chameleon cloud instance provides more functionality for playing out graphics:

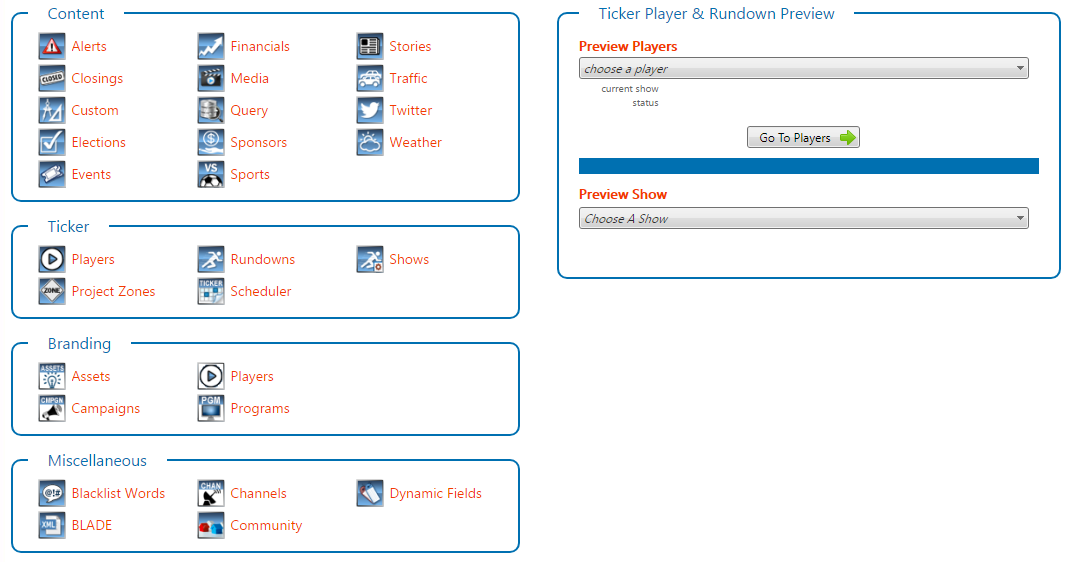
It’s also possible to skin Flow for any purpose whether it’s for OEM partners, internal customer support or distinguishing between instances. Here are a few examples of Flow headers:

In the last example, it shows an example of Chameleon as an OEM product for Ross Video. We are seeking interest from new OEM partners who wish to integrate Chameleon into their own product eco-system. Everyone needs good data so Chameleon is an excellent fit for many products.

GT World Tour 2 in Nürburgring

June 21st and 22nd, I took part in season 2’s 2nd World Tour event of Gran Tourismo.  This stop took place at the famous Nürburgring 24h track in Germany. The esport tournament that took place was a relatively small event compared to the main attraction, the 24h ADAC race.  Nonetheless the GT event, went very well with Team Toyota winning the Manufacturer’s Series and Igor Fraga from Brazil went home with the Nations Cup Top Prize.

World Tour 1 took place in Paris in early March with Tour 3, New York happening in August, Tour 4 in Salzburg in September and Tour 5 in Tokyo in October.    That said, the focus of this blog isn’t on the tournament and work itself, but rather the adventure that goes along with it.

We’ll start with the race itself.   Race enthusiasts I’m sure are quite familiar with the ADAC 24h race, but for those who live in a bubble in North America, we might not be aware of this race that takes place over 24 hours in the middle of nowhere Germany.  Some 200,000 people come by to partake in this event, and catch a glimpse of these 200 vehicles driving at 200+ km/h for a full 24 hours.

You can wiki this info, but I’ll provide a Coles Notes version of it.  The race comprises of around 200 vehicles, with a minimum of 2 drivers/maximum 4 drivers participating.  Each allowed to drive for 150 mins with a 120 mins break in between drives. A single lap is around 28km give or take a few meters, and the winner is the team that drives the longest in distance over that 24 hour time period.   Past winner and record holder drive up to 158 laps… which equals driving from Halifax, through Montreal, to New York and finishing in Fort Lauderdale, Florida.. Or… driving from NYC to Las Vegas. In 24 hours.

By my calculations, at about 11l/100km… that’s around 440 liters of fuel used per car, totally 89,000 liters of fuel.  And I was told about 200 tires per car are used throughout the tournament depending on conditions. That seems high, but what do I know.   

As I mentioned, there are around 200,000 visitors in attendance, 60,000 parking spaces available, 1.5 million square meters of camping sites, with 146 showers, and 680 mobile toilets positioned around the track.

Because this takes place, pretty much,  in the middle of nowhere, the production staff including myself stayed about 20 mins away at a campground.  Convenient, but with very little nearby in terms of amenities.

The days were long as is usual for this type of production.   But what makes it worth it, most of the time, is the after party. At other tours the after party usually takes place at the tournament’s location.  But for the Nürburgring stop, the party was even further in the middle of nowhere.

About 5 km away from the stands and venue, the crew took a bus to a parking location.  Once there, we arrived at a field 100,000 sq meters in size. We needed to walk to the grounds for about 1km.

Surrounded with thousands of people celebrating, playing discotech music, firing fireworks every few minutes, all the while, fast cars whizzing by every few seconds.

Pure tailgating style partying, along with bbq food was served at our GT chained fenced location, where all the players, organizers were enjoying their time watching the cars go by.  

The always talented DJ Lenny Ibizarre was again the entertainment at this after party offering a wide range of dance music while providing some dance moves of his own.  

DJ Ibizarre. Picture Courtesy of JZ.

I, as always, had a great time with the Boombox crew.  

A thank you to PDI and Kazunori Yamauchi for again, making this tournament happen.

Some people ended up staying late into the wee early morning, but I had to catch a flight at 9:50am in Frankfurt.   By midnight, the race still had 15 ½ hours to go. By the time the race ended, I was already 30,000 ft over Newfoundland.

Passed the finish line with Gran Turismo World Championship 2018

The 2018 Gran Turismo World Championship concluded this weekend in Monaco, with a thrilling end to a 3 month, 4 region tournament showcasing the world’s best GT eSport drivers.  3 regional finals took place in Tokyo, Madrid and Las Vegas filtering the hundreds of competitors down to the top 30 players, competing for the first ever Nations Cup in Monte Carlo.  

Boombox, our partner, also produced the eFifa 2018 World Championships, were again at the production helm, responsible for the on-air web broadcasts of the tournaments.  Once again, Bannister Lake was called upon to assist with on-air graphics and data management.  Polyphonic Digital Inc (PDI), the makers of the world famous game, assisted in providing data for the tournaments.

For Bannister, we had a few challenges that had to be overcome.  With the experience from US Open and eFIFA, it made some of the challenges easier to overcome.  On this project, I was the sole Xpression operator, operating 2 Xpressions, monitoring google sheets data, moderating 3 different formats of competition (semi-finals, Manufactures Series and the finals format) and playing out some of the in venue stage screens.  

Dashboard, a Ross UI platform assisted in making things easier as some triggers required more than 1 graphic and output channel to be triggered in sync.  We also linked PBus connection with the switcher, in order to sync driver cameras, with their lowerthirds.  This gave the technical director the ability to go to 3 boxes at any time and have the correct name/flag/manufacture of each of the drivers. 

Chameleon was once again used to filter some of the data coming from google sheets, and categorizing them for each of the competition formats, along with standings based on points and finish position.  

It was a fun project.  Considering we were using a European TV Production truck… it was amazing working on an English produced show, in a German truck with Dutch Engineers, Japanese clients, with a French production crew, produced in a Spanish, French and American country. 

TJ Walker (Head of Production, Boombox) and William Robitaille (Director & TP, Boombox) testing out the game


Jay Zusko, Technical Director. Testing out the game.


Make shift control room in Las Vegas


Myself and Toyo-San Teramoto, from PDI, responsible for in-game stats


Kazunori Yamauchi, Head of Gran Turismo with Sarah Lemarchand, Producer for Boombox


Boombox ENG crew posing in Madrid


European Final Stage


Monaco stage in-progress


Las Vegas game monitors


Control Room in Marquee Nightclub in Las Vegas


Advantage Chameleon: Bannister Lake’s Data Solution Scores at the US Open  

By Alain Savoie, Creative and Technical Director, Bannister Lake Software

The 2018 US Open celebrated its 50th year this season at the USTA Billie Jean National Tennis Center in Flushing Meadows, NY. Approximately 870 players took part in the two-week tournament which included 899 games played with over 700,000 spectators in attendance. Fans got a glimpse of their favorite tennis stars making history, including Naomi Osaka, the first Japanese player ever to win a Grand Slam singles championship and Novak Djokovic tying Pete Sampras’ record to become third among all-time Grand Slam champions.

While ESPN held the exclusive broadcast rights to the tournament, this was Van Wagner Sports and Entertainment’s (VWSE) sixth year of producing the video board and LED production for the main show courts & around the grounds. Marquee matches took place at the Arthur Ashe Stadium, alongside a full slate of daytime and evening matches inside the newly re-constructed Louis Armstrong Stadium and the intimate Grandstand Stadium. Van Wagner’s responsibilities included both in-stadium screen production for the 3 show courts, as well as the numerous grounds displays showcasing the matches on 16 televised courts throughout the facility.

On July 10th, approximately 5 weeks before the start of the tournament, Alain Savoie from Bannister Lake and J. Marty Dormany of The Academy of Lower Thirds were approached by Nate McCoart, Director of Technical Operations at VWSE Productions to produce a Ross Video XPression-based graphics package for the tournament.

VWSE is no stranger to XPression as they have deployed XPression Graphics Engines on numerous events over the past years, but this was their first implementation of XPression at the US Open.

“For a few years now we have been wanting to leverage XPression and the ability to render dynamic graphics in real-time for this particular project. We are thrilled that Alain was able to make that vision a reality with us this year and look forward to continuing our relationship with Bannister Lake and AcademyL3.  Without an all-star team from the designers to the operators, we would never be able to make this happen, especially given the timeline and complex nature of the project.” – Nate McCoart, Director of Technical Operations at VWSE Productions.

The project also included data integration with SMT, the tournament’s data provider. The signage around the facility included standard 16×9 video displays, ribbon boards, a vertical tower screen and an 80 foot by 12 foot “Superwall” in the South Plaza outside Arthur Ashe Stadium.  Having multiple displays with non-standard aspect ratios meant we needed to incorporate Ross’ new multi-display real-time graphics designer and controller, Tessera feature in XPression.

While in principle, creating a graphic package in 5 weeks is relatively do-able, it became far more complicated considering the tight turnaround and the method in which  SMT was going to be providing data, which included different xml files sent every second that a matches’ statistical data was being updated (roughly 200,000 xml files), we needed a solution that could handle and filter the vast amounts of data, and in turn generate a simple API that multiple XPression systems could handle.

With production taking place in 3 separate stadiums as well as on the grounds, this data feed needed to incorporate a simple call up method for any possible matches. In addition, the XPression graphic scenes would have to accommodate the variations between Men’s Singles, Women’s Singles and Doubles. These requirements were extremely complex and required a mission-critical solution quickly.

“We knew Bannister Lake’s Chameleon could handle the complexity. It’s the industry’s most powerful engine for aggregating any data type and it’s the only way we could have pulled off the US Open project under the extreme time constrictions; that and all the hard work by Alain and the team.”- Georg Hentsch , President Bannister Lake.

Chameleon software has been used for years to create and automate broadcast tickers, primarily in the Canadian media market. Chameleon’s features include aggregating and moderating feeds such as news, weather, sports, traffic, financial, elections and social media data. Its specialty has always been to generate automated rundowns and output tickers for network television and digital signage. Only recently has Chameleon been utilized for event-based productions; most notably eSports tournaments which typically includes hundreds of matches played over a short amount of time with a large number of players.

Sound familiar?

Some graphic samples were sent to our team on July 26th, and we began receiving data from SMT on Aug 8th for testing, which meant we were able to create and test scenes and scenarios. Chameleon has tight integration with Ross XPression’s API, which meant, dealing with ticker elements such as matches in-progress/scheduled/completed, along with messaging and social media, were treated as broadcast tickers, as oppose to native sequence items. However, the pressing question was: Does Chameleon’s ticker support integration with Ross’s Tessera option? This has never been tested before.

We were thrilled to discover that not only does Chameleon support Tessera, it was relatively easy to create a display solution. With only 30 minutes of playing around with the feature, we were able to quickly build large formatted scenes, populated with Chameleon data, and generate large scaled tickers for venue and in-stadium signage.

Working with VWSE, Alain Savoie has implemented the first XPression Tessera or Tessera SE project without Ross Video or one of our dealers assisting.  Tessera was created to synchronize the outputs of multiple XPression engines together to create one massive display. The first project for XPression Tessera was over 21,000 pixels wide and used up to 12 channels. That can be intimidating, but Alain has done what we hoped others will; tried it and found out it isn’t as scary as it seems. Instead, it can be quite empowering.” – Patrick Twomey, Director of Xpression Product Marketing

The XPression scenes required style layouts that complimented the 5 set matches for men’s singles, the 3 set matches for women’s and other single events, and the double names for doubles matches. This was needed for both the ticker solutions and for the main screen broadcast. Therefore, on the automated ticker side, the layouts needed to change automatically, while on the main screen, the operators needed to guarantee the scenes were going to look correct, regardless of what matches were played. This meant the XPression scenes required a lot of Visual Logic, a feature that made it easy to program the different layouts in XPression.

Visual Logic screen shot

 The manual main screens were also automated up to a point. Chameleon generated an XML URL, which included everything that we needed for every match during the tournament. Using some of XPression’s powerful scripting features, the entire graphics package would change based on the single MatchID SMT provided. By entering the match ID number into Ross Video’s Dashboard, it automatically transformed the scene layouts to accommodate the match type and populated the text fields and graphics for every aspect of the match, including player names, flags, headshots, scores, sets winners, challenges remaining and others. In some cases, the PlayerID generated from the MatchID, linked to player profile scenes which included their personal info such as place of birth, height, weight, handed and others.

Chameleon data

This workflow was significant for the post production process as well. In the past, editors and graphic designers had to work throughout the night to create the next day’s matchup graphics. Utilizing XPression powered by Chameleon’s data integration, everything was rendered in real-time. As a result, hundreds of graphic design and operator hours were saved during this years’ production.

The production was executed flawlessly without any graphic issues. We had a total of 7 XPressions running simultaneously with 15 output channels, displaying 15 different screen layout styles using Tessera. On four of the XPressions, Tessera was running as a single engine in order to call up full frame graphics and stadium fascias at the same time. Plus, we had 11 tickers running different content on different layouts as well.

“Because the Xpression project and the Bannister Lake data software was set up so well, it allowed us the flexibility to handle the workflow changes as they popped up. Because we had to trigger the fullscreen clips and fascia simultaneously, we had hotkeys all over the keyboard! That simple Xpression feature improved our workflow by letting us keep the focus in one place. I think the client was impressed with how smoothly everything went, including some last-minute changes on the fly.“ – Jeannemarie Tracey & Michelle Lippitt,  New York based Xpression/Chyron Operators

The XPression templates were created with enough flexibility that CG operators had the choice between using linked data or manual entry or using Sequencer instead of Dashboard. The original concept was for the XPression scenes to be fully operational using Dashboard so that scenes and templates could be called up using a single button. However, the system had the flexibility to allow the 4 operators working on the project to use the operational workflow that worked best for them, all driven by the single MatchID.

Dashboard was used to trigger tickers for the place-based signage around the venues. In some cases, the vision switcher was also able to trigger the different ticker layouts for the South Plaza Superwall at the venue using Dashboard in combination with RossTalk commands.

Throughout the event we were also receiving closed caption data from VITAC, for both the Arthur Ashe and Louis Armstrong stadiums, connected via Datalinq. Our original idea was to have the Datalinq server at one location feed all the systems. Although in principle it was a good idea, it did create concerns if something were to happen to the data server. So instead, we had the Datalinqs spread to multiple locations. Closed captioning had its own Datalinq on a separate system. The Chameleon Datalinq was setup locally on every XPression. Social media and special 50th anniversary player data was on another Datalinq server.

Chameleon however, was installed locally on one of the backup XPressions, serving as the gateway between SMT and output. As backup, our SMT US Open reader was also being used simultaneously on our Bannister Lake Cloud server in case anything were to happen. If the primary server were to go down, it was an easy swap of IP addresses to get our score bugs and data up and running.

Since we were all enclosed on our own network, the production staff was using an open WiFi connection. We needed an easy way for them to enter daily and hourly messages on our venue tickers. Bannister Lake’s Community data service provided the solution. We created an account for the US Open producers and had them enter stories on our cloud instance. Using our Bannister Lake’s Community reader, we pulled those news items every minute and automatically had them appear on the tickers, without any operator intervention.

In addition to news, match stats, games in-progress, schedule, completed and weather info, we also showcased the grounds’ practice schedule, which automatically appears every morning as fans entered the venue. Fans could also interact with social media using Tagboard’s Social Media engine which was powering the moderation of Twitter, Facebook and Instagram photos, all funneled through Chameleon.

The US Open was an absolute beast of a project, and we learned a lot from the experience. We’re extremely confident with the solutions we devised and discovered that we could apply these same techniques on multiple types of high-profile, complex, data-centric events and production scenarios. A big thank you to VWSE Productions for accommodating Bannister Lake during this production as well as to The Academy of Lower Thirds for entrusting us with this assignment.

Bannister Lake Software a Smash at the 2018 US Open

Bannister Lake played a vital role at this year’s US Open at the USTA Billie Jean National Tennis Center in Flushing Meadows, NY. Bannister Lake’s powerful data engine Chameleon served as the data management solution for multiple data feeds from a diverse set of sources. Chameleon was used to reformat, filter, moderate and distribute data and graphics to dozens of various shaped digital signs throughout the tennis facility. Bannister Lake was instrumental in devising the workflows and processes that handled over 250,000 XML files corresponding to the participation of over 1000 players playing hundreds of matches. The complexity of the project was compounded with Chameleon also taking on responsibility for managing other data sources including weather, event news, social media, schedules, headshots, scores, sets winners, standings and other tournament related data. Player’s personal biographical data such as place of birth, height, weight, handed and others information was also included.

“We knew Bannister Lake’s Chameleon could handle the complexity. It’s the industry’s most powerful engine for aggregating any data type and it’s the only way we could have pulled off the US Open project under the extreme time constraints; that and all the hard work by our team.” said Georg Hentsch, President Bannister Lake.

“Our extensive work in both the broadcast market and in eSports prepared us for the production challenges of the US Open. Chameleon has powered a variety of event-based productions, most notably eSports tournaments which typically includes hundreds of matches played over a short amount of time with a large number of players. So, we were more than ready.” said Alain Savoie, Creative and Technical Director at Bannister Lake.

Bannister Lake’s unique workflow was built around leveraging the single Match ID unique identifier which was used to drive all the data associated with a particular match. Chameleon was then able to use automation to populate the various graphics templates and tickers that were in turn distributed via Ross Video’s Tessera and XPression graphics engines to the screens throughout the facility. In total, 7 XPressions running simultaneously with 15 output channels, displaying 15 different screen layout styles were utilized. In addition, 11 tickers running different content on different layouts were also being used.

In addition to Chameleon, Bannister Lake provided a complete cloud-based backup system and their unique Community data service. Community allowed editorial and production teams at the US Open to contribute news and essential information to the hundreds of thousands of tennis fans who attended the event.


Smile with an Emoji!

Emojis

Bannister Lake has been hard at work the last few months.   Our Election software was used during the Ontario elections at 3 different Networks (Global TV, TV Ontario and TFO); we took part in an eSports playoff series for EA’s FIFA World Cup; Branding is fully integrated inside Chameleon, making Chameleon an even more powerful tool in production.  

EMOJIs… 

One of the features that has always been available with Chameleon and it’s rendering engine, is the ability to display globally supported Emojis.  Often found in Tweets, emojis can also be added to news stories.   An example is this: 

I’m 😊 today because it’s ☀ outside.  The 💐are blooming and 🐦 are chirping. If only my 👨‍👩‍👧was here with 🤷‍♀️

gets translated to this on output: 

This has been a requirement for production personnel for years, since most CG broadcast systems don’t support it.  But with Chameleon Web, it works without having to do anything.  

To add an emoji while typing, simply Press Win + period (.) or Win + semicolon (;)  in Windows 10

Custom Content Type

Custom has been added to Chameleon a while back as a content type, but until recently, only available as a blade output.   Now, Custom is part of our rundown output, which means your ticker can include virtually any type of formatted content.  

One example for our demo is a list of recipes you may want to cycle through. 

Another very useful way to use Custom is with google sheets. One idea is when you want to display results from a sports tournament, and the tournament officials are using Google sheets to order their round robins or playoff brackets.   Google sheets can import the various visible tabs and automatically create custom results with the appropriate tags. 

For more information on the reader, go to our wiki page. 

Query Sponsors

Branding has now been integrated with Chameleon, making it easier for users to add some branding assets to their workflow.   But a major bonus that comes with the integration of branding with data, means that you can create conditional branding assets.   

As a simple example… maybe you create a house ID for your broadcast that will showcase a sponsor based on the type of weather in your area.  

Note in the image above, the Demo Assets Sponsor Banner was selected as the template, and a Query Weather Sponsor was given as the HouseID/Name.   But additionally, we picked “Query Sponsor based on Toronto Weather” as the condition. 

The conditions you see in the query includes: if Clear, show a RayBan sponsor.  If Cloudy, show Diesel wear sponsor.  If Rain show umbrella sponsor.   Coincidentally, in Toronto at the time of writing this blog, it was ‘none of the above’.

This feature allows you to create an unlimited amount of conditions.  If you’re in a major city with a major sports team, and that team wins a title.. your promo banner could have a related sponsor.  But if they loose that title/game, then automatically another promo banner would appear.  

And with Chameleon’s vast data collection, you can come up with anything to display at any time.  

Chameleon: The Culmination of Brando & Super Ticker

Chameleon is simply that, the very best of 2 separate products brought together. As a whole Chameleon is certainly greater than the sum of its predecessors: Brando & Super Ticker.

Putting ticker and news functionality together with branding isn’t a new idea. At its most rudimentary level, branding layers such as logos are placed over top of existing ticker elements. Not until the arrival of Chameleon have these 2 distinct workflows been integrated together, not just slapped over top each other.

Chameleon Sample Output

Shown here, the programming schedule read from traffic is fully integrated into one Chameleon interface so that both elements from news and branding can take advantage of programming data. Sponsors and as run logs can all be managed from this one singular UI. Of course Chameleon is still multi user content management solution so many producers and can be working on it at the same time.

Chameleon-UI

In the end, Chameleon is end of the long evolutionary road of 2 amazing products finally coming together.

Chameleon Pilot at WRDSB Secondary Schools

At the beginning of the school calendar year (Sept ’17) the Waterloo Regional District School Board (WRDSB) allowed Chameleon into the secondary schools on a pilot project. The project, deliver the school announcements in a more interesting and interactive way. Now half way through the school year, over half the high schools in the region are now using Chameleon as part of their workflow.

School announcements are still delivered over the schools PA system, but many schools are doing more. Radio broadcast/recording of announcements and digital displays are just a few of the new methods. Problem is managing these displays. Schools have little budget for expensive signage solutions. They are also tasked with keeping content updated. Most use Google Slides so the entire presentation needs to be updated daily.

Chameleon is showing is value to the regions schools and growing in popularity. For the first time ever, high school scores for basketball, volleyball are being shown in the schools – not just reserved for the board’s web site which few look at, certainly not students. This is possible with Chameleon’s content groups and user levels. Regional information can be made ‘global’ and shared by all schools, while each school has it’s own localized content which only they can see.

http://blcloud.net/wrdsb

Want to hear more about this pilot project? Send your questions to: danny@bannisterlake.com